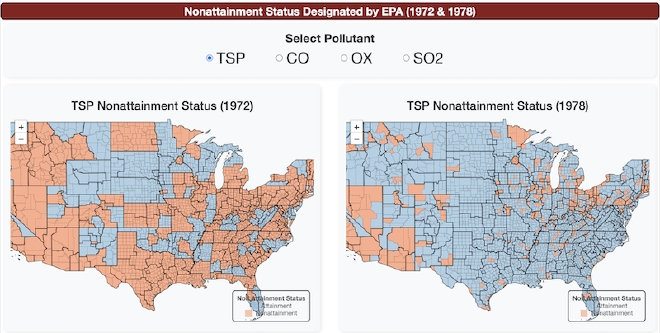
Nonattainment status in 1972 and 1978
·1 min
Ben Heep (UMass undergraduate student) and I developed an interactive map using a Shiny app to visualize the nonattainment status of U.S. counties for four criteria pollutants—TSP, CO, Ozone, and SO₂—in 1972 and 1978. The map allows users to compare county-level nonattainment status between the two years, alongside county-level economic conditions. You can explore the map using this link https://yongjoonp-nonattainment-7278.share.connect.posit.cloud/ or by clicking the image below.
The data for the map are drawn from one of my working papers, Geographic Resolution in Environmental Policy: EPA’s Shift from Regions to Counties Under the Clean Air Act. Feel free to reach out with any questions or suggestions for improvement!
